The purpose of the balance printout is to provide a snapshot of the company's financial status – both income statement and balance sheet. It shows the development and comparison of accounts between the selected year and the previous year, including opening values, changes and index.
The printout can be generated as PDF, Excel or sent as an attachment by email.
See print dialog
Go to Financial and select "Accounting" → "Chart of accounts".
On the chart of accounts page, click the printer icon in the top right corner.
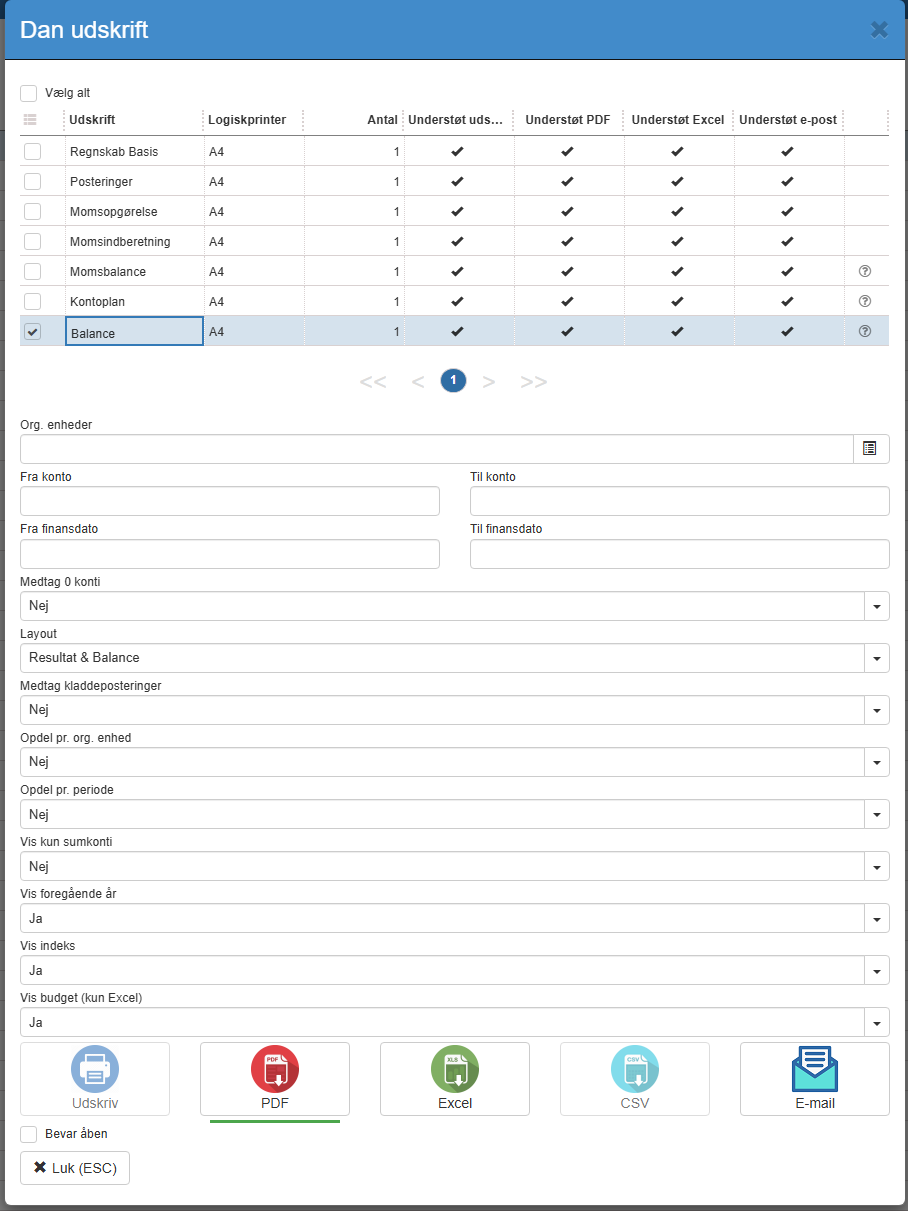
Select the "Balance" printout.
Org. units (organization / department selection)
Select which organizations or units should be included.
From / to account
Limit the balance to an account range if you only want to show a subset of the chart of accounts.
From / to financial date
Select the period you want the balance to cover. The dates are used to calculate columns for changes, balance and year-to-date. The date is based on the financial date from the postings.
Include 0 accounts
Yes: Accounts without postings are included.
No: Accounts without postings are excluded.
Layout
The printout supports 2 different layouts. “Income statement” is particularly suited to operating accounts and “Balance sheet” is particularly suited to balance sheet accounts.
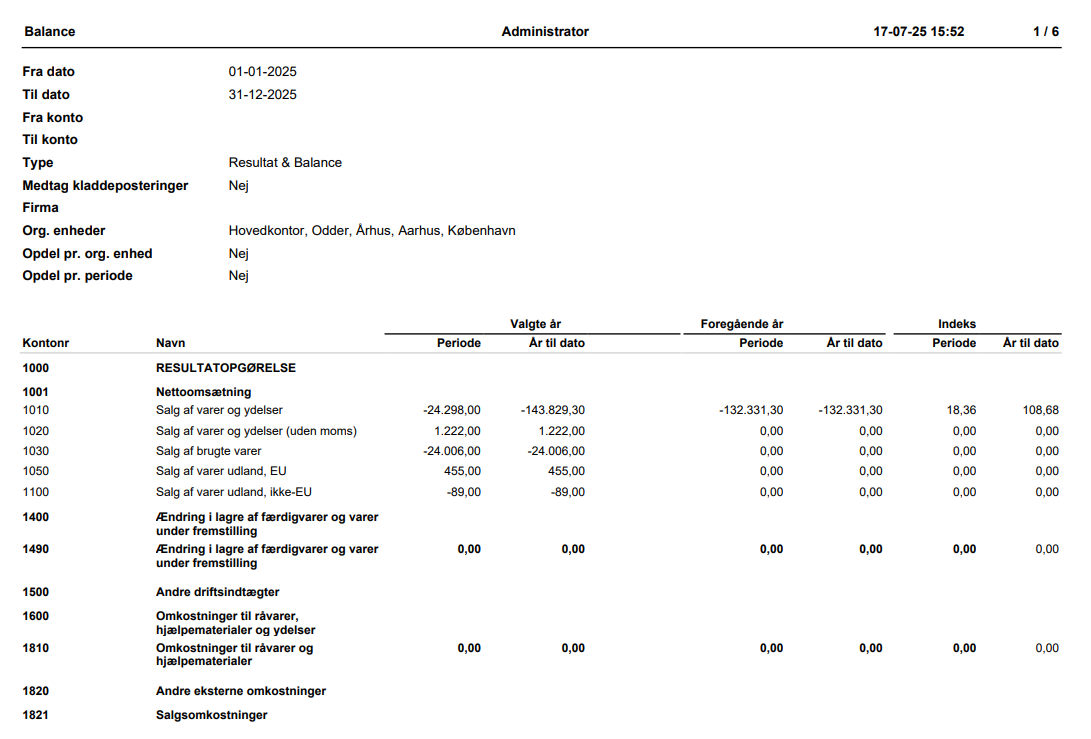
The columns in the income statement layout are as follows

Account no. – The number of the account
Name – Account name
Period - selected year – change in the period.
Year to date – selected year - current value as of the end date.
Period - previous year – change in the period.
Year to date – previous year - current value as of the end date.
Index (period) – percentage change compared with last year.
Index (year to date) – percentage change compared with last year.
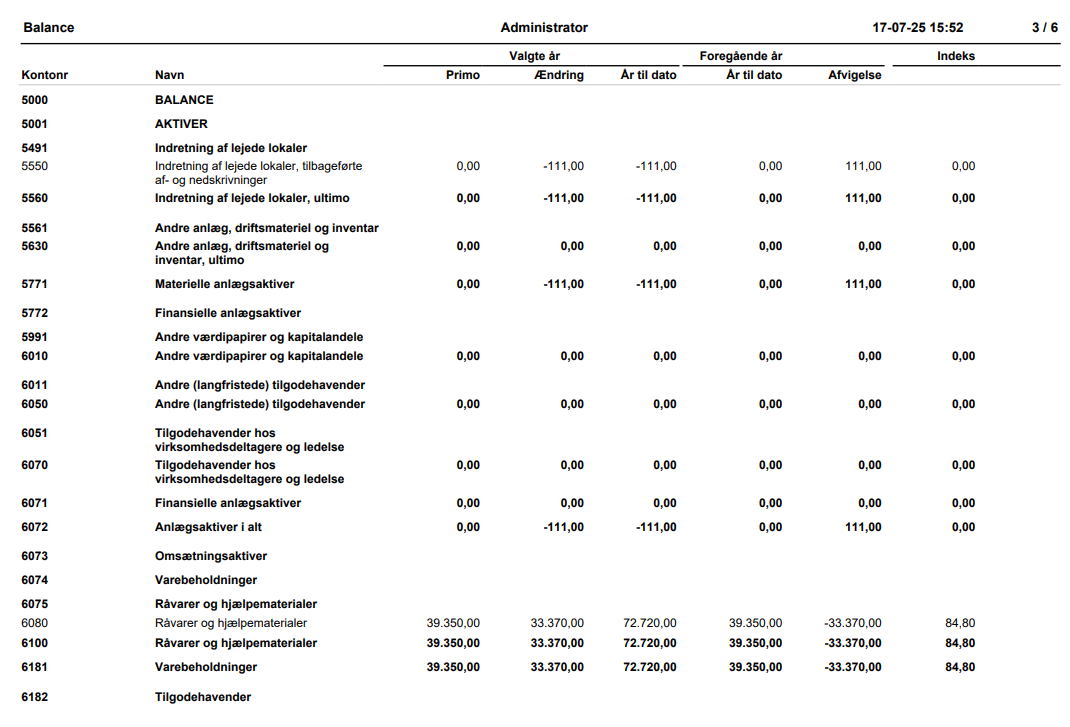
The columns in the balance sheet layout are as follows
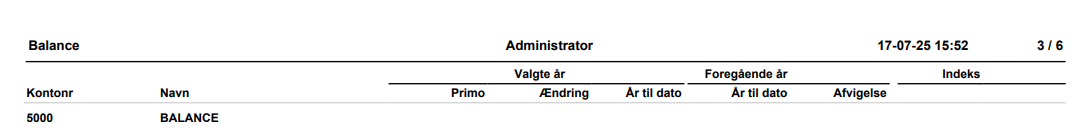
Account no. – The number of the account
Name – Account name
Opening - selected year – Opening balance before the start of the period.
Change – selected year - change in the period.
Year to date – selected year - current value as of the end date.
Year to date – previous year - current value as of the end date.
Variance – difference between year to date this year compared with last year
Index (year to date) – percentage change compared with last year.
Select whether draft postings (not posted) should be included in the printout.
Yes: both posted and draft postings are shown
No: only posted postings are shown
Split by
Specify whether the printout should be split by organization, by period or with no split.
In the Excel version, the split is done as columns. In the PDF version, the split is done as new pages but with the same number of columns.
Show only total accounts
Yes: only total accounts (and headings) are shown
No: All accounts are shown
Show previous year
Yes: the printout includes a column for the previous year
No: the printout does not include a column for the previous year.
Show index
Yes: the printout includes a column for index
No: the printout does not include a column for index
The printout is divided into two main sections:
Income statement
Shows income and expenses as well as the result for the year.
Balance sheet
Shows assets, liabilities and equity.
The income statement shows revenue, expenses, financial items and the result for the year
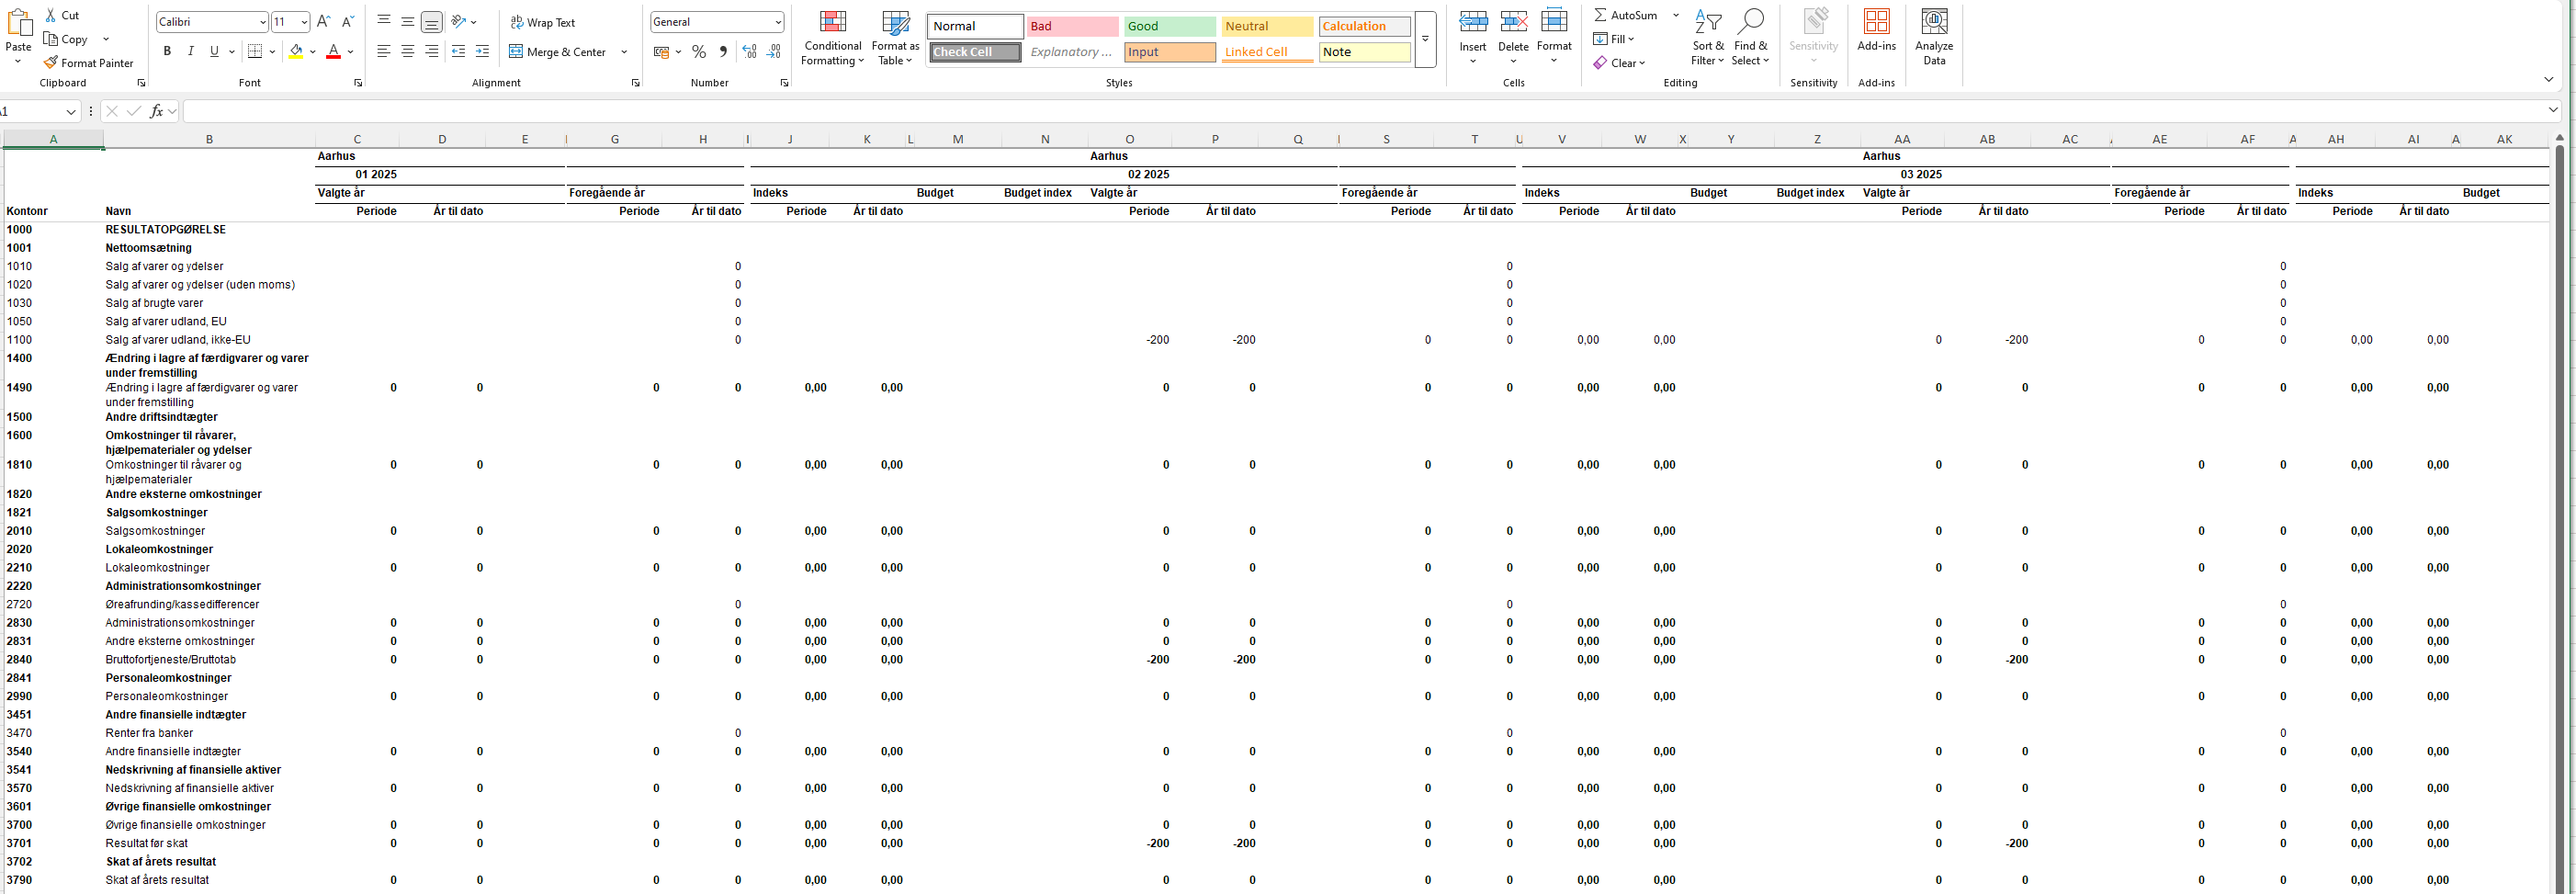
In this example, the balance has been printed for the entire financial year 2025. The income statement is shown at the top, followed by the balance sheet divided into assets and liabilities. The printout compares with the previous year and shows variances and index.
Here is an example of how the fields can be filled in the print dialog if you want to generate a balance for the whole year and compare with last year – without splitting and without draft postings:
| Field Selection |
From date | 01-01-2025 |
To date | 31-12-2025 |
From account | (blank – include all accounts) |
To account | (blank – include all accounts) |
Type | Income statement & Balance sheet |
Include draft postings | No |
Org. units | Head office, Odder, Aarhus, Copenhagen |
Split by org. unit | No |
Split by period | No |
Print format |
The first page of operating accounts and the first page of balance sheet accounts are shown.
The Excel layout may differ, as the selected split by org. unit and/or period is done as columns.
Note also that the Excel version includes budget figures.
By default, the printout only includes posted postings. If you want to include draft postings in the balance, “Include draft postings” must be set to Yes.
The “Index” column helps you quickly identify development or variances on accounts.
If the balance of Total liabilities differs from Total assets, this should be investigated further.
The printout also has a range of settings that control its appearance and behaviour but are not shown in the print dialog. They can be turned on/off or adjusted by support per company. If you want the balance customized, contact support and refer to the relevant setting below. The technical name of each setting is shown in parentheses.
Accounts and summing
Restrict to the current financial year (filteronmeta)
Specify the account used as the total balance (totalbalanceaccountnumber)
Calculate a sum from one account to another (sumfrom, sumto)
Insert an account after a specific account (showafteraccount)
Give an account a different display name on the printout (newaccountdisplayname)
Formatting
Underline the text on specific accounts with a double line (doubleUnderlinedAccounts)
Underline sum accounts (underlineSumAccounts)
Add extra spacing above specific accounts (spaceBefore)
Want to know more?
Read more in these related articles:
Print dialog
This article explains the functions and options of the print dialog in Sapera